Statistically Fitting Process Data Using Geogebra
Table of Contents
Why Geogebra #
Geogebra offers a unique way of optimizing & visualizing its progress in-situ, however, in the screencast I prepared it becomes tricky for Geogebra when you have more than x2 variables involved. This screencast however is useful for trainee & juniors who will certainly admire Geogebra’s ability of ‘dynamic mathematics’ & easy to use yet powerful syntax to manipulate data. Plus it is free & cross-platform, so no strings attached!
Need of a mathematical model based on DCS data #
The need of the hour was to accurately predict certain parameters in a Modelling eq.
- which will describe the process volts consumed by our Electrolyzers (chlor-alkali industry) over its life-cycle duration (~8 years)
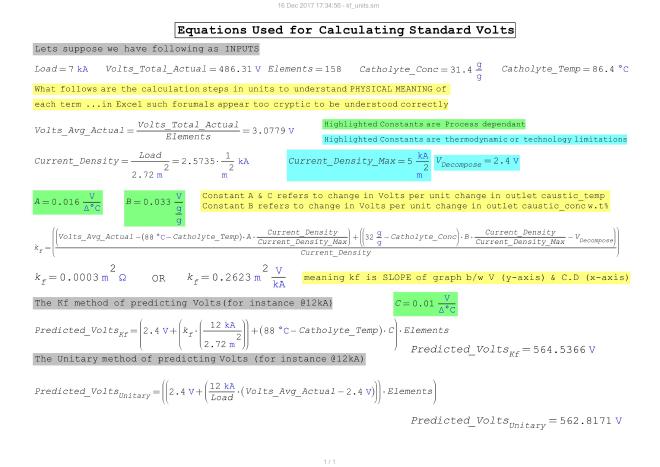
- & how these parameters are effected with the aging of electrolyzer. In process modelling one thing is most vital i.e physical meaning of the variables involved. A basic step to initiate this understanding is performing dimensional analysis (units of measurement) of those variables in mathematical equations involved. This had been done, again using an opensource application Smath Studio.

Theoretical Model #
This theoretical model is being used by both UHDE & AKC x2 big names in Electrolyser manufacturers. This model takes into account outlet caustic concentration, temperature & again of equipment. The last part is important as the model needs large data input to be accurate.
Roadmap #
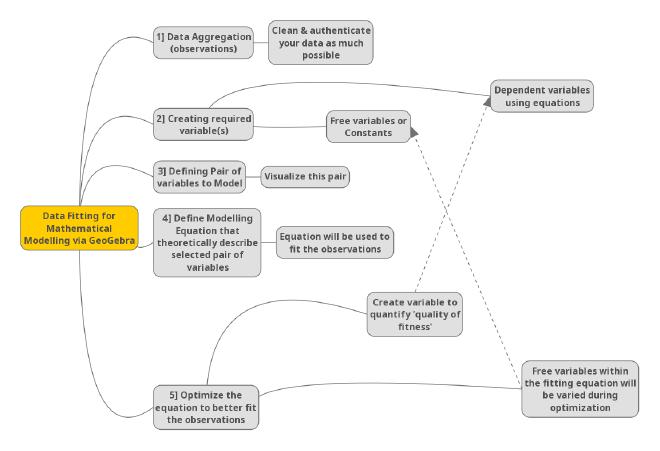
I sketched out a 5-step methodology which will enable achieving above goals:

The following video will tell you how DCS historian data is used for tuning Kf variables to get a near perfect fit for actual voltages
Previous video was deleted on . I have to make anew